
Gather and Analyze Data Assignment: Survey, Mean, Median, and Mode Example
This paper includes a 10-question survey on dental hygiene. The survey will also include a 4-scale rating system, where; 0-never, 1-sometimes, 2-frequently, and 3-always. Survey Questions
The survey questions will be based on the Centers for Disease Prevention and Control’s (2023) oral health tips. Below are the questions:
On a scale of 0-3, with 0 being never, 1 being sometimes, 2 being frequently, and 3 being always;
- How often do you brush your teeth?
- How often do you visit the dentist?
- How often do you floss?
- How often do you use antibacterial mouthwash?
- How often do you smoke or use other tobacco products?
- How often do you eat sugary foods?
- How often do you take sweetened drinks?
- How often do you replace your toothbrush?
- How often do you take healthy and balanced meals?
- How often do you take water?
Struggling with your Gather and Analyze Data assignment or similar homework projects? Our team at My Homework Helpline provides expert support for survey creation, data analysis, and calculating mean, median, and mode. We also help with preparing graphs and slides so your presentation stands out. Visit our math homework helpline today to get reliable homework assistance and complete your assignments with confidence and accuracy.
Responses
The survey was administered to ten participants. Below are the responses (scores):
- How often do you brush your teeth? frequently (2), frequently (2), frequently (2), frequently (2), frequently (2), frequently (2), frequently (2), always (3), always (3), always (3)
- How often do you visit the dentist? Never (0), Sometimes (1), Sometimes (1), frequently (2), frequently (2), frequently (2), frequently (2), frequently (2), always (3), always (3)
- How often do you floss? Never (0), Never (0), Sometimes (1), frequently (2), frequently (2), frequently (2), frequently (2), always (3), always (3), always (3)
- How often do you use antibacterial mouthwash? Never (0), Sometimes (1), Sometimes (1), frequently (2), frequently (2), frequently (2), frequently (2), always (3), always (3), always (3)
- How often do you smoke or use other tobacco products? Never (0), Never (0), Never (0), Never (0), Sometimes (1), frequently (2), frequently (2), always (3), always (3), always (3)
- How often do you eat sugary foods? Never (0), Never (0), Never (0), Never (0), Sometimes (1), Sometimes (1), Sometimes (1), frequently (2), frequently (2), always (3)
- How often do you take sweetened drinks? Never (0), Never (0), Never (0), Sometimes (1), Sometimes (1), Sometimes (1), Sometimes (1), frequently (2), frequently (2), frequently (2)
- How often do you replace your toothbrush? Sometimes (1), Sometimes (1), Sometimes (1), frequently (2), frequently (2), always (3), always (3), always (3), always (3), always (3)
- How often do you take healthy and balanced meals? Sometimes (1), frequently (2), frequently (2), frequently (2), frequently (2), always (3), always (3), always (3), always (3), always (3)
- How often do you take water? Sometimes (1), frequently (2), frequently (2), frequently (2), always (3), always (3), always (3), always (3), always (3), always (3)
Data Analysis
Some common measures of central tendency include the mean, median, and mode. According to Cherry (2022), the mean is the mathematical average of a group of numbers. The mean is computed by summing all of the scores and dividing the total by the number of scores utilized. On the other hand, the median is the midpoint of a set of numbers. For an even-numbered set, the median is found by summing up the two middle digits and dividing the total by two. Lastly, the mode is the most common score in a given number set.
| Questions | Never
(0) |
Sometimes
(1) |
Frequently
(2) |
Always
(3) |
Mean | Median | Mode |
| How often do you brush your teeth?
|
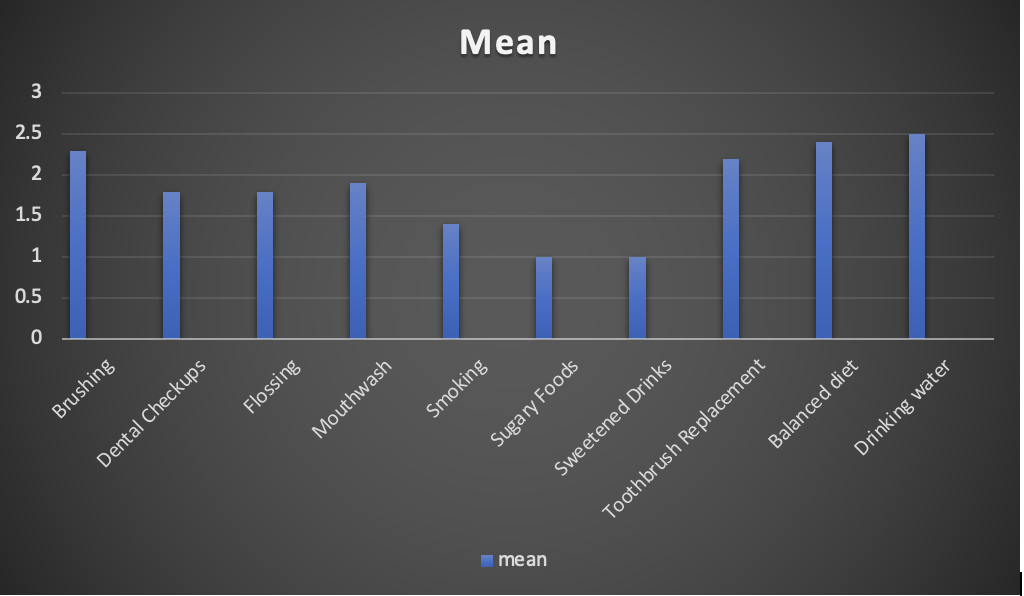
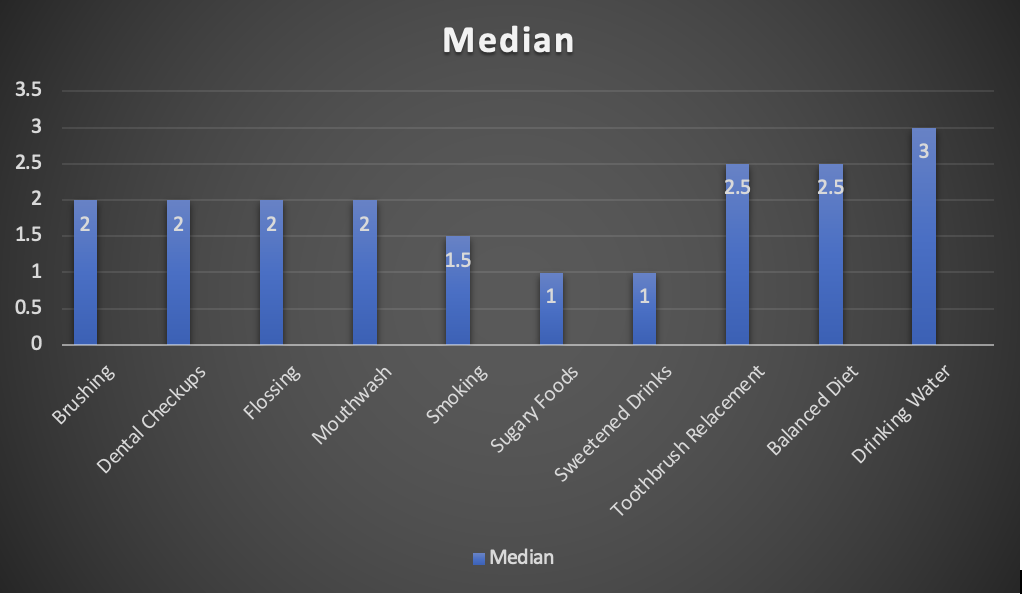
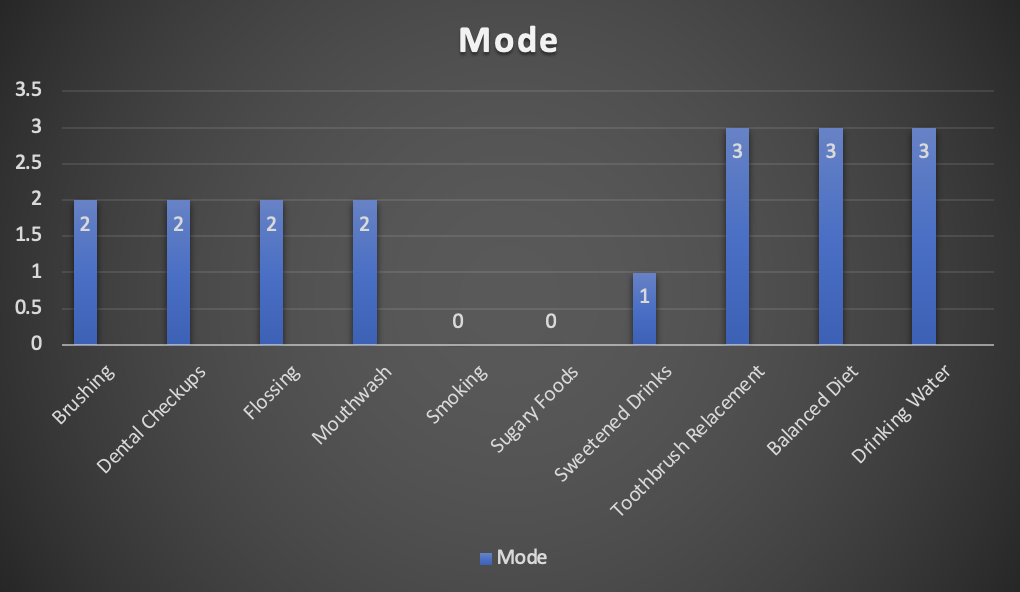
0 | 0 | 7 | 3 | 2.3 | 2 | 2 |
| How often do you visit the dentist?
|
1 | 2 | 5 | 2 | 1.8 | 2 | 2 |
| How often do you floss?
|
2 | 1 | 4 | 3 | 1.8 | 2 | 2 |
| How often do you use antibacterial mouthwash?
|
1 | 2 | 4 | 3 | 1.9 | 2 | 2 |
| How often do you smoke or use other tobacco products?
|
4 | 1 | 2 | 3 | 1.4 | 1.5 | 0 |
| How often do you eat sugary foods?
|
4 | 3 | 2 | 1 | 1 | 1 | 0 |
| How often do you take sweetened drinks?
|
3 | 4 | 3 | 0 | 1 | 1 | 1 |
| How often do you replace your toothbrush?
|
0 | 3 | 2 | 5 | 2.2 | 2.5 | 3 |
| How often do you take healthy and balanced meals?
|
0 | 1 | 4 | 5 | 2.4 | 2.5 | 3 |
| How often do you take water?
|
0 | 1 | 3 | 6 | 2.5 | 3 | 3 |
Visual Presentation
References
Centers for Disease Prevention and Control. (2023). Oral Health Tips | Adult Oral Health | Basics | Oral Health | CDC. CDC. Retrieved March 22, 2023, from https://www.cdc.gov/oralhealth/basics/adult-oral-health/tips.html
Cherry, K. (2022, October 19). How to Find the Mean, Median, and Mode. Verywell Mind. https://www.verywellmind.com/how-to-identify-and-calculate-the-mean-median-or-mode-2795785#:~:text=To%20calculate%20the%20mean%2C%20you,the%20number%20set%20is%206.7.
Assignment Instructions
Gather and Analyze Data
You have been charged with creating a survey for your community! The community is interested in having you create a survey and present the results at the next town hall meeting.
In this project, students will:
Learn about quantitative variables.
- Learn to analyze data for measures of central tendency (mean, median and mode)
- Learn to create an effective presentation with real-world conclusions.
To complete this project you will:
Think of a problem within your community or workplace. The problem needs to be something others will have an interest in solving or will want to share reactions to.
- Create a 10 question survey with quantitative variables (number) on a topic you are interested in. Think of questions where 0 is dislike there is a scale to 4- like. Another way to do this is using 0-never, 1 sometimes, 2 frequently, and 3 always.
- Administer the survey to a minimum of 10 people.
- Analyze your data for the mean, median, and mode of each questions.
- Create a visual from this chapter: bar graph, box and whisker plot, histogram, stem and leaf plot. etc.
- Compile the information into a slide presentation, of at least 5 slides, to present at the next town hall. The presentation should present: the mean, median, and mode of each question, the visual of the data, and conclusions based on the statistics you found in the survey.