

Exploring Opportunity Costs and Market Analysis in ECO202 Module 1
Answer the following questions about opportunity costs:
Define opportunity costs.
Opportunity costs are the gains that a person, investor, or company foregoes in favor of another option.
If you receive a free ticket to a concert for your favorite music artist, what is your opportunity cost of attending the concert?
The opportunity cost of going to the concert might be the subsequent most productive use of time. In other words, you can sacrifice time that you might be using to complete an important task, such as preparing for an upcoming exam. For example, if you don’t finish a project on time, you could have to settle for a lesser score on your next exam as the opportunity cost.
Suppose you own a printing/graphics business that provides professional printing and marketing services and web design to your customers. What might be an example of an opportunity cost that your business might experience?
Your company may get a large order from a customer who wants a custom graphic designed for their brand, but you may have to choose between turning down the sale and losing the customer’s business and money or accepting the order and sacrificing personal time to meet the deadline.
Answer the following questions about a production possibilities curve:
Why does the production possibilities curve have a shape which bows outward?
The rising opportunity cost has caused the production possibilities curve to form an outward bow. It suggests that more of one good must be sacrificed than was required for the preceding unit of each successive good.
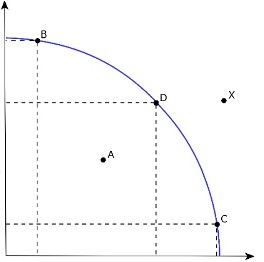
Given the following example of a production possibilities curve for the two goods, why would you not choose point A?
Point A illustrates an inadequate or insufficient utilization of resources because it does not fit on the curve. You will not leverage your resources or output if you choose option A.
Need help with your ECO202 Module 1 assignment? Our experts provide professional homework assistance and support for assignments covering opportunity costs, market analysis, supply and demand shifts, and government interventions. With our guidance, you can complete high-quality work, understand core economic concepts, and submit confidently. Get reliable ECO202 Module 1 homework help and achieve better grades with clear, well-researched solutions tailored for your course requirements.
Given the following example of a production possibilities curve for the two goods, why would you not choose point X?
Points B, D, and C in this PPC example reiterate the maximum production levels for each good. Point X is not attainable with the available resources and production due to its distance from the maximum production capacity. Before you could reach point X, you would necessitate additional resources.
Define both terms and explain the difference between microeconomics and macroeconomics. Is gross domestic product a microeconomic or macroeconomic question? Is the price change of pizza a microeconomic or macroeconomic question?
The scope of macroeconomics is substantially more comprehensive since it examines the economy as a whole. The study of macroeconomics emphasizes broader concerns, such as national unemployment, national income, and the influence of imports and exports. In contrast to macroeconomics, which analyzes whole economies, microeconomics examines people’s actions, often with a narrower emphasis on purchasing and selling a single product or service. Considering that GDP is the standard for calculating national income, any inquiry into GDP would fall within the umbrella of macroeconomics. Pizza prices are a classic example of a concern in microeconomics.
Scans of internal organs using magnetic resonance imaging (MRI). These devices are often covered by subsidized health insurance programs such as Medicare. Consider the following table illustrating hypothetical quantities of individual MRI testing procedures demanded and supplied at various prices. Answer the following questions
(4 points)
| Price | Quantity Demanded | Quantity Supplied |
| $100 | 100,000 | 40,000 |
| $300 | 90,000 | 60,000 |
| $500 | 80,000 | 80,000 |
| $700 | 70,000 | 100,000 |
| $900 | 60,000 | 120,000 |
What is the equilibrium price and equilibrium quantity of MRI tests?
The equilibrium price is $500, and the quantity is 80,000 units.
Suppose that the government establishes a health plan guaranteeing that all qualified participants can purchase MRI tests at an effective price to the individual of $100 per test. How many MRI tests are now demanded? Is the result in the market a surplus or shortage? How large is the surplus or shortage?
The above chart demonstrates that at $100 per test, consumers would want 100,000 tests if the government set the effective price of MRI exams at $100. In this situation, 100,000 MRI tests will be used. The manufacturing cost of producing 100,000 MRI exams is $700.
As a result, the $100 government-guaranteed price for an MRI scan is $700 for each scan, and the overall cost to society is $70,000,000 ($700 * 100,000).
The guaranteed cost of an MRI scan is $700. Thus the government pays a subsidy of $600 for each scan under its coverage plan, for a total subsidy of $60,000,000 (or $600 x 100,000 scans).
Paint and paintbrushes are complement goods. Describe what occurs in both markets when there is an increase in the price of paint. In your explanation, be sure and describe which one is a change in quantity demanded with movement along the demand curve and which one is a change in demand with a shift in the entire demand curve:
Explain what happens to the demand curve for paint when the price of paint increases.
The first effect of a rise in the price is a rightward shift in the demand curve. Similarly, while demand stays the same, the quantity of paint purchased may fall due to this price shift.
Explain what happens to the demand curve for paintbrushes when the price of paint increases.
If the price of paint goes up, fewer people will want to buy paintbrushes, leading the demand curve to slope down. As a complementary product, paint brushes would also see a decline in demand if the price of paint dropped.
Briefly explain the three tax systems – proportional, progressive and regressive. As you explain each one, also compare the relationship between marginal tax rate and average tax rate as income rises for each one.
In a progressive tax structure, those with higher incomes pay a more significant percentage of their income in tax than those with lower incomes. A progressive tax system raises both the marginal and average tax rates as income grows. If the percentage of income taxed decreases as one’s income increases, the tax rate is considered regressive. These types of taxes disproportionately affect those with lower incomes. Average tax rates are higher than marginal tax rates. All taxpayers would be subject to the same percentage of taxation under a proportional rate. The percentage of taxable income is unaffected by changes in income level. The average tax rate under a proportional tax system is the same as the marginal tax rate, whether one’s income increases or decreases.
The next 2 parts to this question give changes that have occurred in the broiler chicken market. For each change in a determinant given, draw in the change that would occur on the supply/demand graph for chicken that is provided. Be sure and review what causes the curve to shift and what causes a movement along the curve as well as what determinants affect supply and what affect demand. Once you have drawn in your change, write a short explanation for each question discussing what would be the new equilibrium price and quantity levels due to the change. In other words, has equilibrium price or quantity increased, decreased or stayed the same, etc. (To draw in changes on the graph in Microsoft Word, you will go to the Insert menu and select Shapes and then choose lines or arrows to draw in your shifts or show movement along the supply or demand curves.)
- In the chicken market, assume there have been substantial technological advancements made in the production processes for producing chicken. At the same time, consumer income has decreased (assume chicken is a normal good).
Due to improvements in manufacturing technology, the supply curve for chicken has moved to the right, from S to S1. However, when disposable income drops, the demand for chicken falls, too, moving the chicken demand curve to the left, from D to D1. In the new equilibrium, the price of chicken has fallen from P1 to P2, but demand remains unchanged.
- Chicken and beef are substitute products. Assume the price of beef has increased considerably. What happens in the chicken market?
In a situation where two items are perfect substitutes, an increase in the price of one would lead to a rise in demand for the other. As beef prices rise, consumers will likely shift their focus to chicken, a more economically viable option. A rightward shift in the chicken demand curve shows rising demand. Since the rising cost of beef has a more significant impact on consumer preferences, demand for this product is likely to alter. If the demand curve for chicken were to move to the right while supply remained constant, the market equilibrium quantity and the price would both rise.
Find an article that identifies a change in supply or a change in demand. Use the article to fulfill the following instructions and questions:
-
- Copy and paste the article into your homework assignment. Be sure and cite your reference for the article. Indicate the source, author, title, date, and page for the article you have chosen.
The demand for eggs, which had fallen during January-February due to the bird flu outbreak, has bounced back with rise in consumption of key poultry commodity to boost immunity amid the second wave of the COVID-19 pandemic, according to government officials and industry experts.
The revival in demand amid tight supplies after bird flu outbreak and a sharp rise in poultry feed cost have led to an increase in retail prices to Rs 6-7 per egg depending on the areas.
But farm gate rates have not gone up commensurate to rise in input cost, affecting farmers, they said.
Egg is among the protein-rich foods prescribed for COVID-19 patients and is the cheapest source of protein available to people, experts said.
“There is a trend in increase in consumption of eggs in the last few months. Egg has the highest 11 per cent protein content,” O P Chaudhary, Joint Secretary in the Animal Husbandry, Poultry and Dairy Ministry, told PTI.
Another official in the ministry said it is difficult to estimate a monthly rise in egg consumption.
However, he said India’s annual consumption has increased to 86 eggs per person in 2019-20 from 79 eggs per person in the previous year.
Indian Broiler Group Managing Director Gulrej Alam said the poultry industry was impacted badly during April-May 2020 last year due to the lockdown as demand for both eggs and chicken declined.
However, he said demand revived between June and December last year.
Alam said the demand got again impacted in January-February this year due to bird flu outbreak. In June 2020, monthly consumption stood at average 7 eggs per person, which fell to 4 eggs per person due to bird flu scare.
“After March, the demand has bounced back to average 7 eggs per person as demand for eggs as immunity booster caught the minds of people during the second wave of the pandemic,” he said.
The demand for eggs is more in urban areas when compared with rural areas. When the urban demand rises, prices automatically go up, said Praveen Garg, Zonal Chairman at National Egg Coordination Committee.
“Egg is still the cheapest source of protein today. At a retail price of Rs 7 per egg, you are getting 11 per cent protein. In no other source of protein, you will get this much protein at just Rs 7. Therefore, there is good demand for egg,” said Prasanna Pedgaonkar, general manager of poultry-focused Venky’s.
The supply of eggs is tight as poultry farms are not operating at their full capacity in many parts of the country after bird flu early this year, covid-induced restrictions and other reasons like rising feed cost, he added.
As per the government data, India’s egg production rose to 140 billion in 2019-20 from 103 billion in 2018-19. And 98 per cent of the eggs produced is consumed in the country itself.
Gurugram-based startup Eggoz cofounder Abhishek Negi said: “We have seen huge surge in demand for branded and Eggoz eggs in the past few months since the onset of second wave of covid pandemic.”
Eggoz branded business has grown by more than 100 per cent month-on-month over the past few months, he said. “Customers are becoming increasingly aware of health and immunity boosting benefits of eggs,” Negi said.
He informed that Eggoz has launched an enriched variant called Nutraplus where two eggs can fulfill daily recommended intake of Vitamin D and B12 among other vitamins.
“An egg that used to fetch around Rs 3-3.5/piece for the farmers in the months of April, May in Haryana touched all time high of Rs 5.5 and is now trailing at Rs 4.8/piece,” Negi said.
This has provided much-needed financial boost to layer farmers in the country and will help them meet their higher cost of production due to increased prices of soya, Negi said.
Unpackaged eggs in retail are currently being sold at around 7-8 per piece in untraceable format which has increased from normal Rs 5-6 per piece, he said.
Branded eggs are sold at higher rates, around Rs 10 and above.
Eggoz has its own poultry farm in Bihar and Madhya Pradesh. It also has tie ups with other poultry farms for procurement of eggs.
- Write a short summary addressing the following items:
- What shift occurred in either supply or demand and in which direction would the supply or demand have shifted.
- What factor changed that caused the shift. Describe the changes in the factor that have occurred.
- Indicate evidence in the article of whether the market is an international, national, regional, or local market.
The Indian eggs market faced an increase in demand for eggs during the COVID-19 outbreak. According to Business Standard, the demand increased because patients with COVID-19 often are advised to eat eggs, which are high in protein and very inexpensive (2021). The increase in demand shifted the demand curve to the right. Due to increased feed costs and the spread of bird flu earlier in 2021, several regions of the nation are experiencing egg shortages. The decrease in supply shifted the supply curve to the left. The Indian eggs market is national. According to official statistics, India’s egg production increased to 140 billion in 2019-20 from 103 billion the year before. Additionally, almost all (98%) of the country’s egg supply is eaten domestically (Business Standard 2021).
Read the article, The Price of Wine is Dropping Fast, provided at the following:
https://www.cnn.com/2020/02/16/business/grape-surplus-cheap-wine-trnd/index.html Answer the following three questions:
- What factors led to an increase in the supply of wine?
The decrease in demand for wine, the surplus from California grapevines, and a slowdown in growth.
- What factors led to a decrease in demand for wine?
The industry has not tapped into new opportunities which lie in the millennials. It has not focused on producing products that appeal to the younger generation.
- What will the industry need to do to restore the long-term equilibrium in this market?
California vineyard owners will need to reduce their production acreage if they want to restore equilibrium to the market.
Explain what an externality is and then give an example. How can government correct a negative externality? How can government encourage a positive externality?
An externality results from an economic activity that affects parties outside of the activity itself and may be either positive or negative. In the past, for instance, businesses employed less safe, less expensive production methods to save costs while degrading the environment. The government might fix this by passing rules requiring specific safety measures (Epstein, 2017). Businesses may also conduct internal investigations that might be useful in manufacturing a rival firm’s products.
References
Business-Standard. (2021, June 2). Demand for eggs bounces back amid 2nd Covid wave. Business Standard News. Retrieved January 27, 2023, from https://www.business-standard.com/article/current-affairs/demand-for-eggs-bounces-back-amid-2nd-covid-wave-121060200776_1.html.
Epstein, R. A. (2017). Positive and negative externalities in real estate development. Minn. L. Rev., 102, 1493.